- Notion Gems
- Posts
- Your Notion template looks boring? Don't use progress bars, use visuals instead.
Your Notion template looks boring? Don't use progress bars, use visuals instead.
Learn how to create an impressive progress tracker that will make your template memorable.
Manuel
April 29, 2023

Progress bars are boring. I also use them in my Notion templates. But I've wondered if there wasn't a different way to show progress toward a goal.
Last week, I was working on my diet planner template when I realized that adding a water tracker would be a helpful feature.
I instantly started working on it. I created a database. I added a button. A view, and…
As I finished sipping my blood orange fruit tea, boom! An idea.💡
What if instead of using a classic progress bar, I could show a glass that empties like this cup of tea?
Sounds good. Let's try something.
A few hours later…
Satisfied with the result, I posted a preview on Twitter…
And what? 🤯

A wonderful success that I did not expect! 😮
Want me to show you how I did it?
Yeah!
Ok, let’s do it. But before, I want to explain how it works, so you can adapt it to different situations according to your creativity and make your Notion templates even more unique. 🎉
How it works
To achieve a remarkable progression effect, you will need the following:
A button to add pages to a database of tracking toward a goal
A sequence of images representing the progression
A formula based on the total tracking that displays the corresponding image in the progression.
The relation and rollup properties are the glue that binds it all together.
So how does it work? Let’s dig in…
When you click the button, new tracking for the goal defined in its configuration is recorded.
Then, a formula compares the tracking total with the value corresponding to the image and sets its visibility.
Finally, the gallery view of the water tracker shows only the glass with visible = true.
That’s all.
And now, let’s see how to replicate the example of the water tracker.
A step-by-step guide on how to build the water tracker
When I design a new Notion template, I always start with the databases. I define the data I need to manage and then build the views using that data.
For this project, you need the following three databases:
Water Goals
Water Tracking
Water Glasses
The water goals database
In the water goals database, define your daily goals on how much water you should drink.
It has the following properties:
Name, for convenience, write the target number of liters, i.e., 3 L.
L, the number of liters to drink in a day, in this case, 3.
The water tracking database
The tracking database will collect records of all the daily glasses of water you drink. Each glass should contain about 200 ml of water.
Besides the Name property, it has only a relation to the goal database. Make it bidirectional.
The water glasses database
Finally, create the database with images of the glasses from full to empty.
Each glass you show has 5 images from 0 ml to 1 L. For each glass of water (for this tracker, it’s considered a gulp), you drink about 200 ml.
So you will have to create n * 5 pages where n is the number of maximum L you want to track. If they were 3 L, you would need to add 15 pages, as in the example of the figure below.

This database has the following properties:
Name: describes the amount of ml from 0 to 1 L, i.e., 800 ml.
L: the liter referred to in the image. If you track a maximum of 3 L, you will have 5 pages with L = 1, 5 with L = 2, and 5 with L= 3.
Gulp: corresponds to the number of gulps (i.e., a glass of 200 ml of water you drink) to which the image corresponds. For example, if Name = 1 L, the gulp will be 0, and the image will show a full glass. If Name = 0 ml, the gulp will be 5, and the image will show an empty glass.
Finally, add a relation property to goals.
Let's bring all the pieces together to create a unified whole
Now we use the rollup properties to collect the information we need to create the effect of emptying the glass.
We need to bring the gulps tracked into the glasses database so that we can use a formula to figure out which glass to show.
Add to goals a rollup property that sums the gulps related to that goal. Through a formula, create a copy of that property (we need this because rollup properties are not present among other rollup properties).
Add to the water glasses database two rollup properties from the goals relation, the L property, and the sum of the gulps tracked.
You will end up in a situation like this:

The visibility formula
As the last thing, we create the function that does the magic.

We must choose which image to show based on the gulps tracked per liter of goal. The conditions that must occur are:
Do not display images that belong to an L higher than the goal:
prop("L") > toNumber(prop("L (Goal)"))
Display the image of a full glass (with gulp = 0) when the number of gulps tracked is less than the number of gulps it would take to start drinking that glass:
toNumber(prop("Gulps")) < (prop("L") - 1) * 5 and prop("Gulp")==0
Display the image of the empty glass (with gulp = 5) if the number of gulps tracked exceeds what it would take to drink it all:
toNumber(prop("Gulps")) > prop("L") * 5 and prop("Gulp") == 5)
Display the image of the glass corresponding precisely to the number of gulps tracked, and do not display the others:
if(toNumber(prop("Gulps")) == (prop("L") - 1) * 5 + prop("Gulp"), true, false))
The complete formula:
if(prop("L") > toNumber(prop("Total L")), false, if(or(toNumber(prop("Gulps")) < (prop("L") - 1) * 5 and prop("Gulp") == 0, toNumber(prop("Gulps")) > prop("L") * 5 and prop("Gulp") == 5), true, if(toNumber(prop("Gulps")) == (prop("L") - 1) * 5 + prop("Gulp"), true, false)))Now that you’ve configured the databases, you can build the page to show the tracker.
Finally, the tracker
To create the tracker, you need to do only two things:
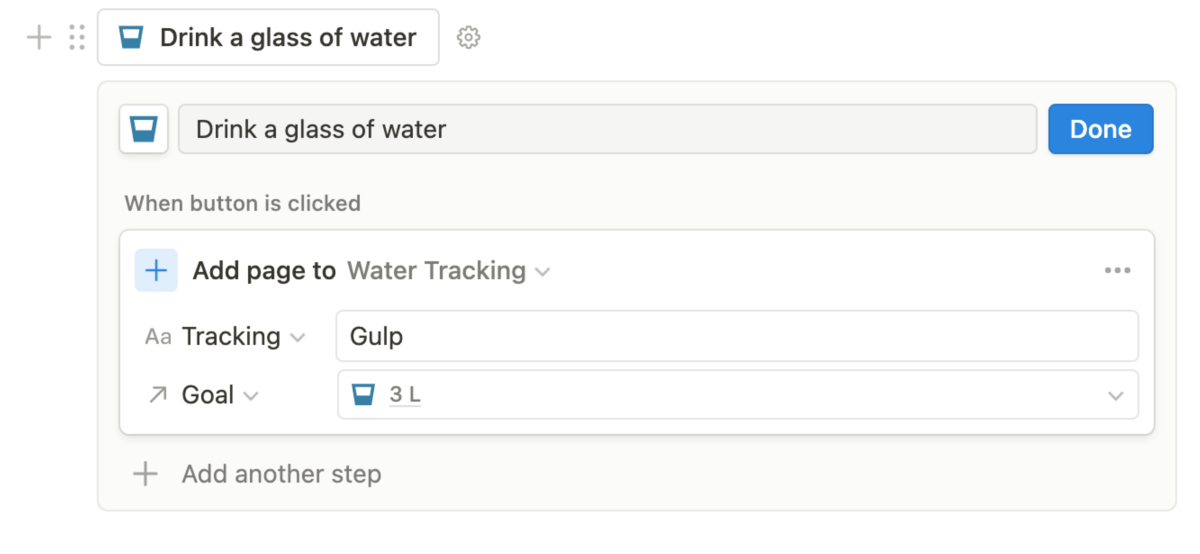
Add a button that adds a new page to the tracking database for a given goal:
Add a gallery view on water glasses with a filter on Visible = Checked and a sort on L and Gulp properties, like this:

And that's it 😎
Final takeaway
I hope you find this tutorial helpful. Let me know how you will use it.
Before we part ways, let me share some ideas on how you can utilize this technique. Some examples include:
A reminder to water the plants
A reward system that displays rewards based on goals achieved
An alert that increases in intensity as the deadline approaches
The limit is only your imagination!
Until next time,
Manuel